This is the third article in the Blog Article Series on Air Pollution.

The previous article here highlighted some examples of applications of low-cost sensors (LCS) by governments, academia, and citizens for citizen awareness, education, and advocacy, in the development of local air pollution plans and other useful air quality products.
While setting up an LCS network can help with the first steps towards collecting hyperlocal air quality data, there are still limitations to be considered when collecting data from an LCS network. These include issues with 1) accuracy and sensitivity of LCS, 2) a short lifespan, as LCS sensors typically last only from 1 to 3 years, and with all sensors, there could still be gaps in 3) spatial coverage. As such, scientists and air quality practitioners try to resolve these limitations by combining or supplementing LCS data or sensors with other solutions.
In addition, as LCS networks often involve many sensors collecting data for an extended period, a large amount of air quality data is collected. The data has the potential to be used for more advanced air quality analyses and research, to understand air quality trends, relationships with meteorological variables, air pollutant dispersion, seasonal characteristics, map air pollution hotspots, associations with health risks, and sources of air pollution. Such advanced applications of air quality data from LCS also include LCS data assimilation with other sensor data, satellite data, dispersion modelling, and other statistical methods and machine learning for air quality research.
Calibration Methods to Improve LCS Accuracy
LCS are usually less accurate, less sensitive, and have a shorter lifespan compared to reference sensors as they are usually made up of simpler and cheaper components as compared to reference sensors and often lack a comprehensive calibration and maintenance programme.
LCS are thus affected to a larger extent by atmospheric conditions such as humidity, temperatures, and interference by other air pollutants. A common calibration approach would be to co-locate an LCS with a reference sensor to derive a mathematical relationship between the co-located LCS and the reference sensor (see Figure 1 below). Tests can be carried out to assess if the equation can be applied for specific seasons or the whole LCS sensor duration setup. A wide range of methods, ranging from simple linear regression to advanced statistical or machine learning methods are used to calibrate LCS against the reference sensor to improve its accuracy. More advanced methods involve essentially the same concept, except that the “correction” can involve dynamic, non-linear equations, and higher dimensional algorithms and mathematical models.

Figure 1. Diagram showing the co-location method for the calibration of LCS
Attributing Air Pollution Sources with Statistical Methods
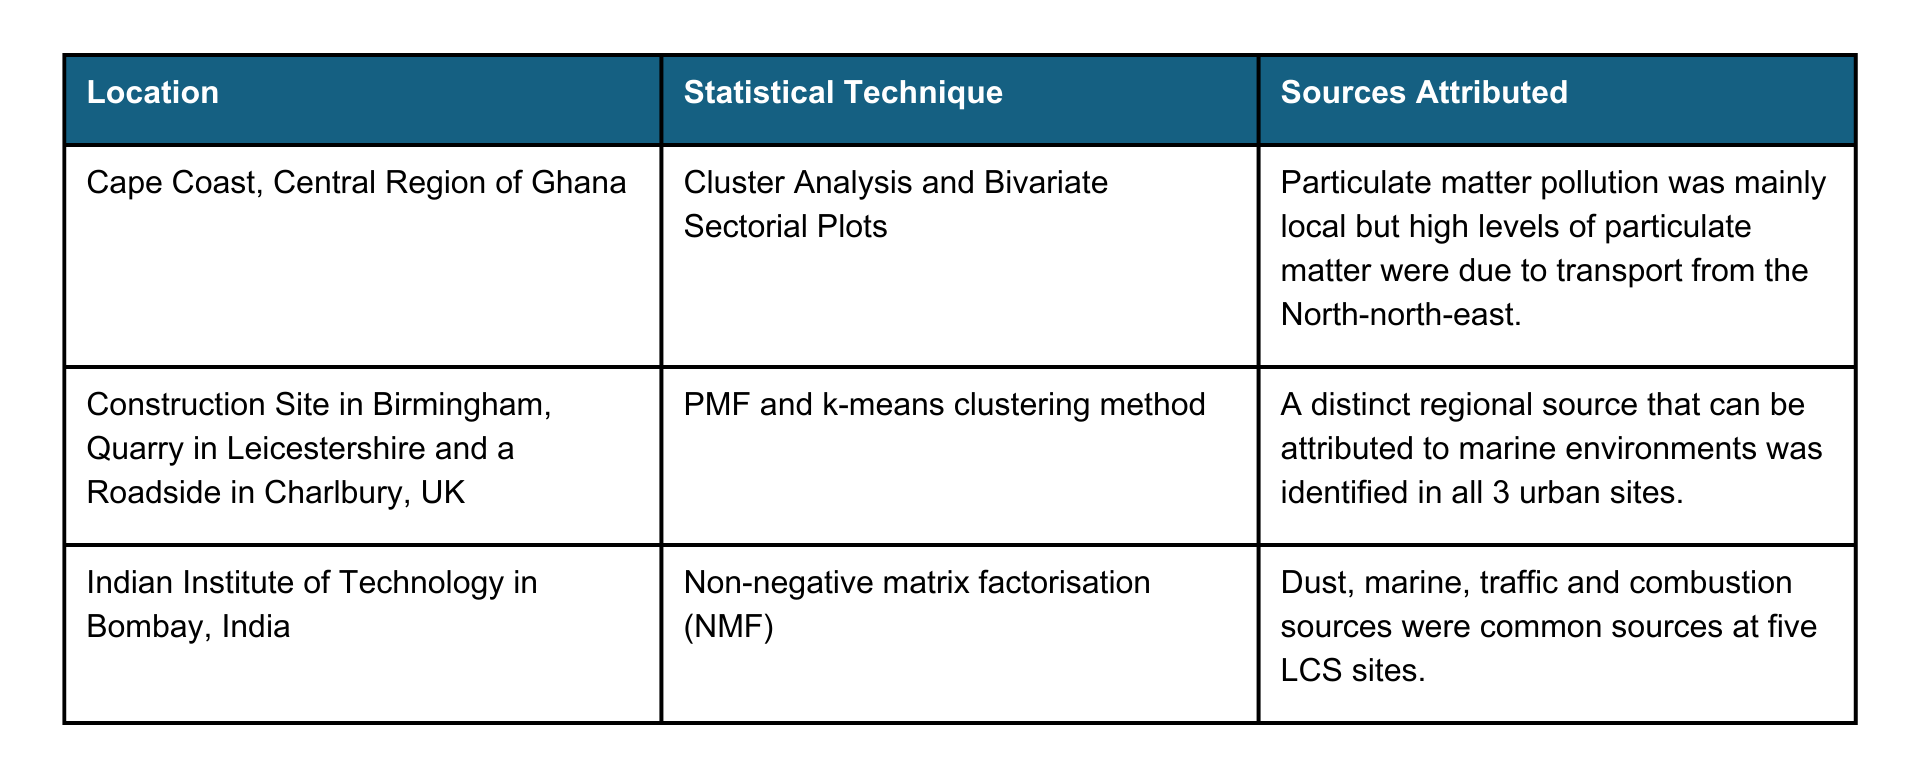
Identifying the main sources of air pollution is important before policies, regulations or interventions can be developed to mitigate air pollution from such sources. Air quality data collected from the LCS can be further analysed to identify the sources of air pollution through statistical methods such as using cluster analysis, Principal Component Analyses (PCA) and Positive Matrix Factorisation (PMF). Some examples of applications of such statistical methods in Ghana, the United Kingdom and India are summarised in the table below:

Table 1. Examples of studies using statistical techniques to attribute main sources of pollutants
Data Fusion for Air Quality Modelling and Forecasting
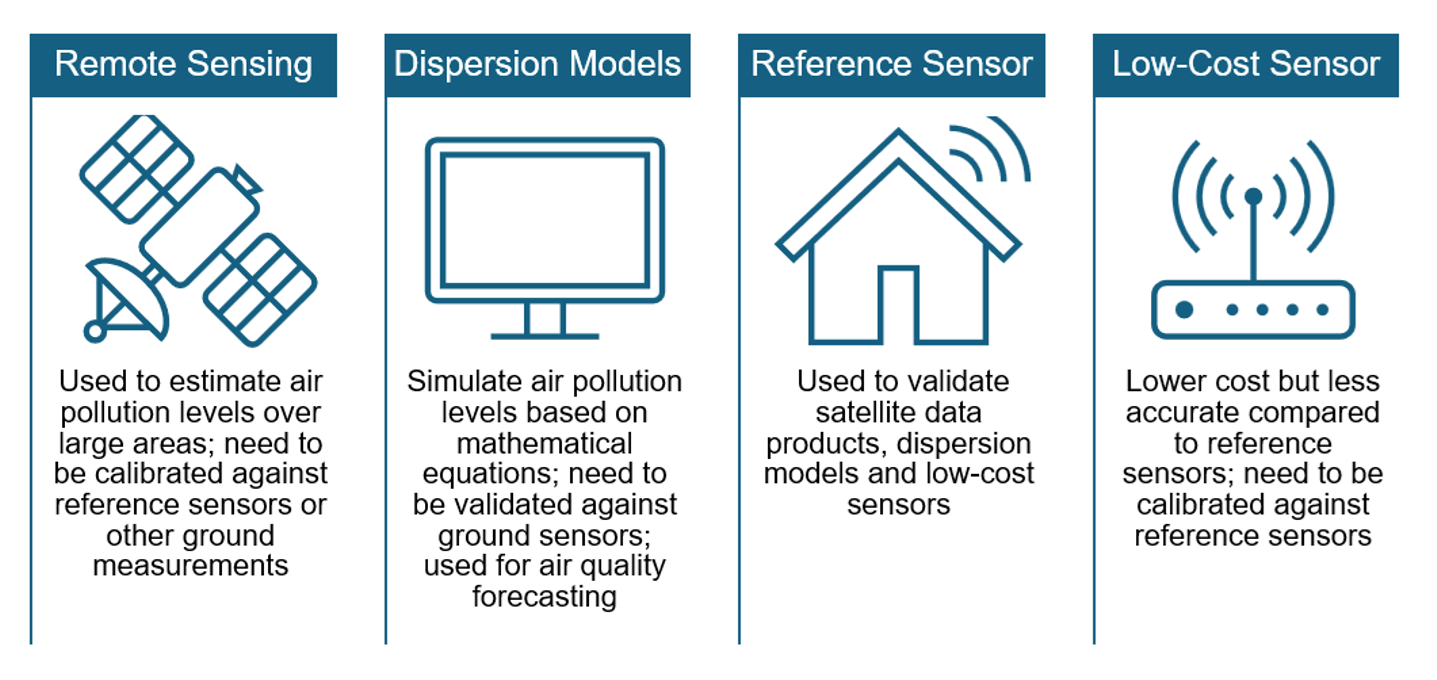
Besides traditional reference sensors and LCS, there are other methods of deriving air pollution data including data from satellite products, and air dispersion or chemical transport models (summarised in Figure 2).
Satellite-derived air quality products are useful for obtaining general air pollution levels over large areas and where high-resolution air quality data is generally not needed. Air dispersion models or chemical transport models are computer models often used to simulate the dispersion, transport, chemical reactions, and deposition of air pollutants based on estimates of air pollutant emissions from multiple sources, with scales ranging from local or street-scale to global scales. The output from air dispersion models must be validated against actual sensor data to assess and quantify model errors. Such models are also needed for air quality forecasting, i.e. predict air quality hours or days in advance for early warning of air pollution events.
As such, combining multiple types of air pollution data can help to reduce the limitations of each type of data source. For example, LCS data was combined with air dispersion modelling to produce an air quality map of air pollution estimates at the urban scale in Nantes, France.
As part of a project between NASA and other organisations in the U.S., scientists are developing a sub-city scale air quality forecasting system from data fusion of models, satellites, in-situ measurements, and LCS. This data fusion tool will be available on the Google Earth Engine platform and will produce hourly estimates and forecasts several days in advance of key air quality parameters at resolutions of 1km to 5km. This tool will be useful for cities that do not have access to air quality monitoring or forecasting products. Users from the government or members of the public will be able to predict and prepare for any air pollution episodes in advance and be aware of the real-time air quality levels to be able to make necessary decisions to reduce their exposure to air pollution. At the end of this study, the tool will be handed over to the UN Environment Programme (UNEP) for further testing.

Figure 2. Summary of the different types of sensors/technologies for estimating air pollution levels
Conclusion
In summary, there are many possible advanced analyses and applications of LCS data. While there are limitations of LCS, there are statistical techniques that could improve its accuracy. Advanced statistical techniques, modelling and remote sensing can also be used together with LCS to identify major sources of air pollution within a city or an area of interest, and for air quality forecasting. However, such applications require more technical knowledge in terms of data processing, data analyses and knowledge of other data types such as satellite-derived air quality products and modelled data.
The next article will introduce in more detail a case study in Singapore where a network of LCS combined with street-scale dispersion modelling provided insights into pollution hotspots and air quality trends along the roads and residential areas in proximity to the roads.

 Locations
