
 Locations


Agile Applications of Machine Learning-Based Estimates of Poverty

Innovation to Support Plastic Collection
UNDP Philippines
Written by: Francis Capistrano, United Nations Development Programme; Danna Ang and Joshua Cortez, Thinking Machines Data Science
With six years remaining, there is still much to be done in order to achieve the 17 Sustainable Development Goals (SDGs) by 2030. According to the Sustainable Development Report 2024, only 16 percent of targets monitored globally are progressing sufficiently (Sachs et al., 2024). The Philippines, though in a relatively better position, is no exception: only 31 percent of its targets are on track. Clearly, actions for the SDGs need to be accelerated in order to end extreme poverty, reduce inequalities, and save the planet.
For progress to be made, quality, timely, and publicly available data to guide actions by government and stakeholders are needed. Unfortunately, a 2023 report on the State of Global SDGs Data finds that such data is sorely lacking. Only 35.6 percent of the data needed for SDGs has been made available by UN member-states for at least two years since 2015 (Goessmann et al., 2023).
The Philippines finds itself in a relatively better situation with just about 55 percent of SDG data available, putting it among the top decile of UN member-states [1]. Government efforts to improve the availability of fresh and useful data on key SDGs must be acknowledged: from making national surveys more regular and detailed, to digitalizing processes that generate and store data. Still, investments are needed to close gaps in the timeliness, frequency, and level of disaggregation of such crucial data.
At the same time, innovations in the sources and methods for generating and analyzing SDG data should be explored, tested, and mainstreamed.
Machine Learning for Granular Poverty Estimation
Take SDG 1: No Poverty; The Philippine Statistics Authority (PSA) has improved the regularity of the Family Income and Expenditure Survey (FIES), which is used to produce official annual income poverty statistics (from every three years to every two), the timeliness of release (reducing the gap to less than a year), and the level of detail (now with statistics for provinces and highly urbanized cities). In addition, PSA has been producing Small Area Estimates of poverty for cities and municipalities [2].
These are undoubtedly great improvements, but still leave gaps in terms of frequency (i.e., the in-between years) and granularity (i.e., smaller than provinces, cities, and municipalities). Addressing these blind spots by further increasing the sample size and frequency of FIES may be considered but will be expensive [3]. Alternative methods of generating more regular and granular estimates of poverty and wellbeing should thus be considered to augment the official statistics.
Can artificial intelligence and nontraditional data sets be used to produce granular, even “hyperlocal,” estimates of poverty and wellbeing?
In 2019, the UN Development Programme (UNDP) in the Philippines and Thinking Machines collaborated to expand on the use of machine learning to develop national yet high-resolution estimates of wellbeing. Thinking Machines is an internationally recognized team of AI and data consultants and implementers. Building on Thinking Machines’ previous work, this experiment tried to improve the efficiency and transparency of the estimation model by using open geospatial data sets: data derived from satellite images (such as nighttime lights and vegetation), points of interest from OpenStreetMaps, and Facebook marketing data [4]. The training data used was the 2017 Demographic and Health Survey (DHS) which includes a wealth index: a score for each household based on the durable goods owned and the characteristics of their housing. The DHS data set also had sufficient features to enable geospatial analysis [5].

Figure 1. How the Machine Learning Model Works to Predict Wealth Index
Thinking Machines has since updated the estimates based on the 2022 DHS. This effort is part of the Artificial Intelligence for Development (AI4D) Research Bank supported by the UNICEF Venture Fund. The updated model has produced wealth index estimates for 5.67 square kilometer grid areas across the country [6]. The estimates produced are robust and close enough to the “ground truth” data from the 2022 DHS [7]. The top 3 drivers of the wealth estimates are brightness of nighttime lights, number of mobile devices connected to the internet, and population density.
It must be noted that the estimates of the relative poverty index (i.e, the reverse of the relative wealth index) are not strictly the same as the poverty rate, as the former is an indicator of asset ownership, while the latter tracks the population earning below the poverty threshold. Nevertheless, both metrics are closely correlated, as shown below.
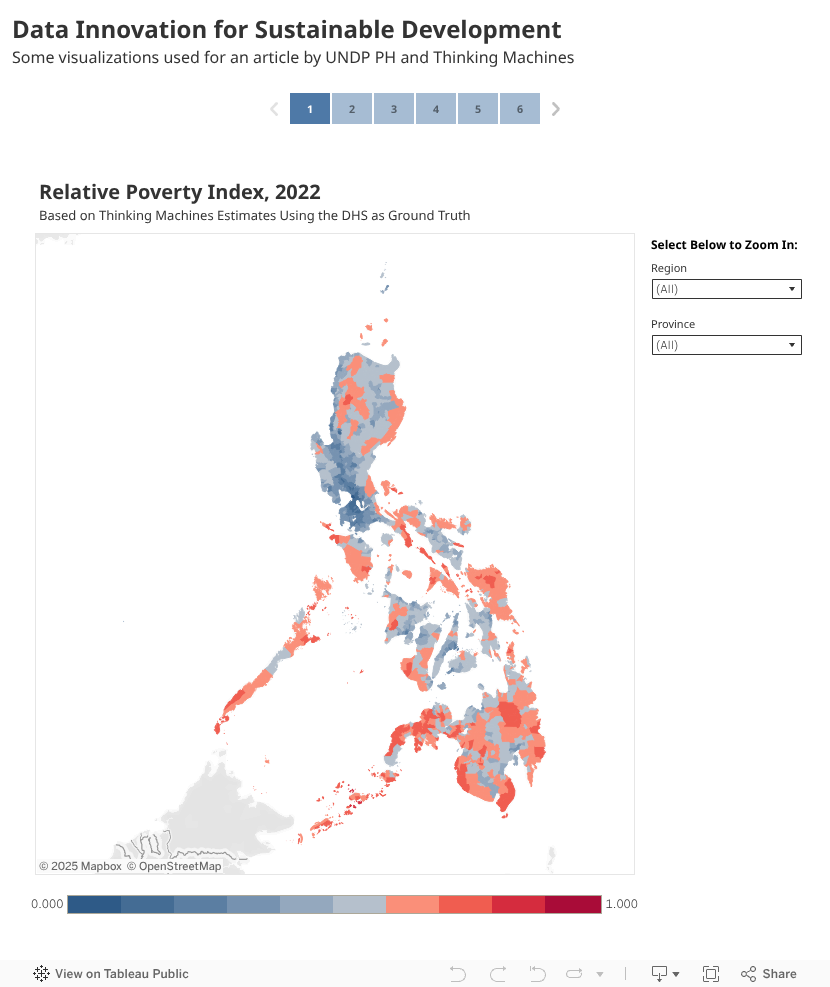
Figure 2. Machine-Learning Generated Estimates of Relative Poverty Index (Inverse of Relative Wealth Index) in 2022 at City Level
It must be noted that the estimates of the relative poverty index (i.e, the reverse of the relative wealth index [9]) are not strictly the same as the poverty rate, as the former is an indicator of asset ownership, while the latter tracks the population earning below the poverty threshold. Nevertheless, both metrics are closely correlated, as shown below.

Around this period, the Asian Development Bank (ADB) was also testing the feasibility of big data and artificial intelligence, including computer vision using satellite imagery, to improve the granularity of poverty estimates in the Philippines and Thailand (see Martinez, et al., 2020 and Addawe & Martinez, 2021).
The 2017 and 2022 wealth index estimates producted by Thinking Machines show an overall decline in poverty, with the national median increasing from 33 percent in 2017 to 41.5 percent in 2022. This trend is consistent with the decline of the official poverty incidence among individuals from 16.7 percent in 2018 to 15.5 percent in 2023 [10]. Furthermore, the granular estimates can identify precisely where the decreases came from. From the maps shown below, one could glean that the reduction could have been driven by the increase in middle-income areas nationwide especially in Luzon.
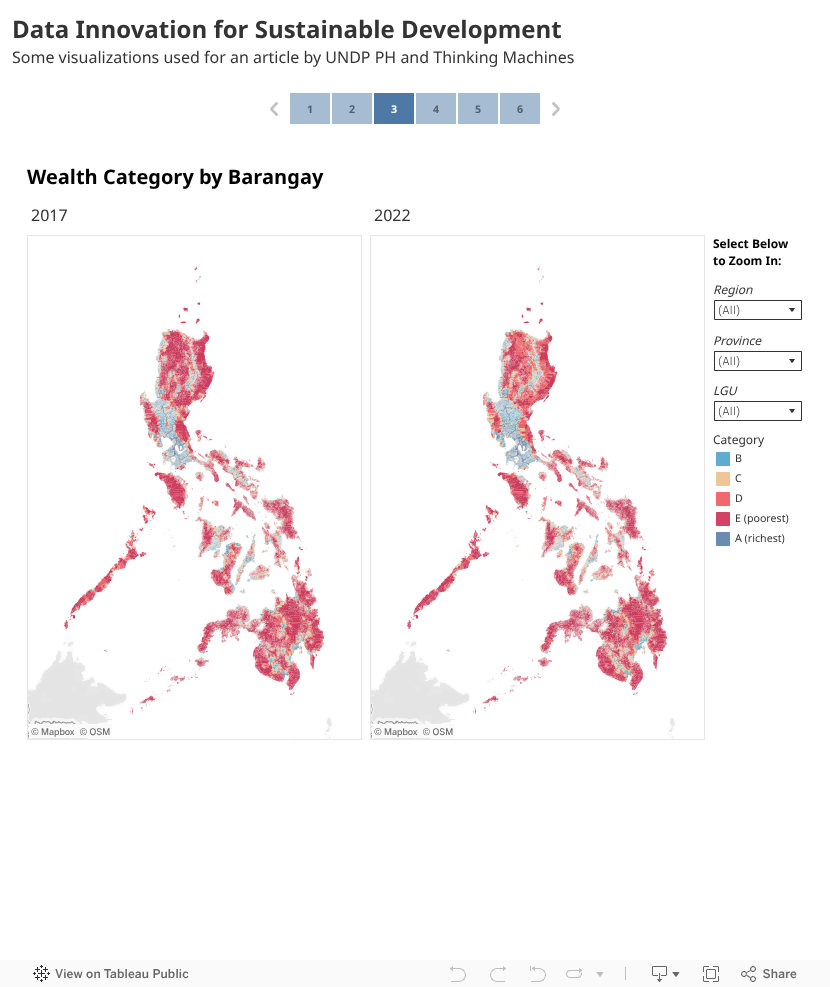

Figure 5. Histograms of Relative Poverty Index Estimates from Machine Learning per Major Island Group, 2017 vs 2022[
Potential Uses for Development
Development organizations like those in the United Nations can and should harness the potential of this innovation to improve their efforts to Leave No One Behind. The technology, used in tandem with other targeting and assessment tools, can be used to guide the overall targeting of resources so that the most underdeveloped areas are prioritized; to enhance the design and delivery of programs and projects; and to augment the evidence base for tracking the results of development interventions.
UNDP in the Philippines considers data and digital innovation as central to achieving its new Country Programme Document (CPD) for 2024 to 2028. Under it, UNDP aims to support the Philippine Government to achieve its development priorities towards a matatag, maginhawa, at panatag na buhay (strongly-rooted, comfortable, and secure life). The CPD focuses on (i) human capital development, inclusion, and resilience-building; (ii) sustainable economic development, innovation, and decent work; and (iii) climate action, environmental sustainability, and disaster resilience.
The following are some opportunities to prototype and test the use of the machine learning-based poverty model in support of these CPD priorities.
On human development: as the country seeks to further reduce poverty to a single-digit rate by 2028, pockets of poverty need to be identified and reached more precisely. The granular poverty estimates could help fine-tune targeting towards geographically isolated and disadvantaged areas. This way, inequality within localities can be addressed. Here is a potential prototype for how this could look like: UNDP and Thinking Machines previously collaborated with the Zero Extreme Poverty 2030 Philippines coalition to map the latter’s on-the-ground presence against the granular poverty estimates. This, among other intelligence gathered, helped the ZEP2030-UNDP collaboration to pinpoint where and how to expand ZEP’s network of local convergences.
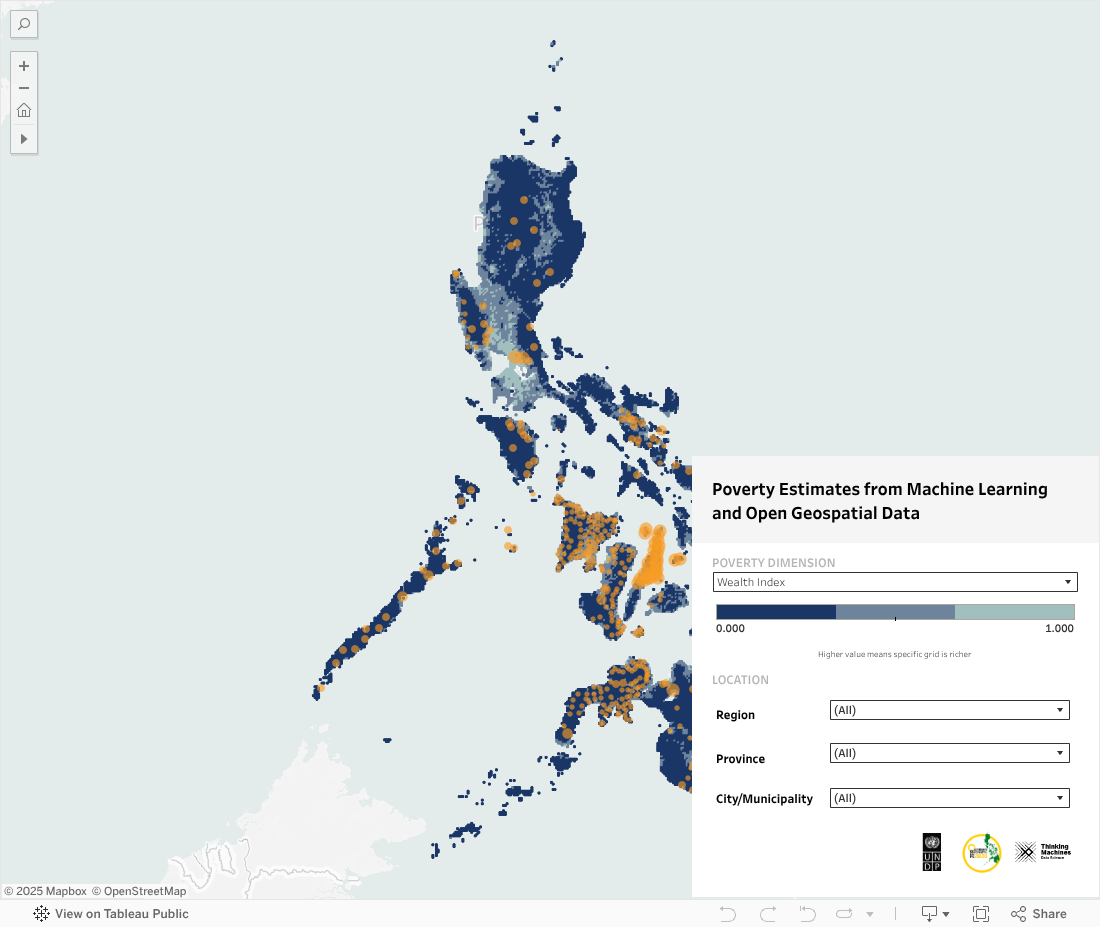
Figure 6. An Early Experiment with ZEP2030 to Pin Local Anti-Poverty Networks and Interventions on the Granular Poverty Map
On economic development: the Philippine government has placed a big bet on innovation as an enabler of economic growth. It recently released the National Innovation Agenda and Strategy Document 2023-2032 to spell out how to foster innovation ecosystems at the national and local levels. As shown below, poverty is inversely correlated with the Department of Trade and Industry’s (DTI) Cities and Municipalities Competitiveness Index (CMCI) and its innovation pillar. This implies that economic competitiveness and innovation could be key ingredients to reducing poverty. UNDP is currently supporting the National Economic and Development Authority (NEDA), which houses the secretariat of the National Innovation Council (NIC), in undertaking research on innovation facilities at the local level and how these can nurture local innovation ecosystems. In turn, these could empower local innovators and entrepreneurs to produce creative, high value-adding, and socially responsive products and services.

Figure 7. An Exploratory Analysis of the Relationship of Competitiveness and Innovation with Poverty
Third, on climate resilience. The Philippines has the highest disaster risk exposure globally according to the 2023 World Risk Report. Based on the recently-submitted National Adaptation Plan (NAP) 2023-2050, 18 of the 82 provinces have the highest exposure to climate risks [12]. The economic and human costs of climate change and natural disasters could reach as much as 7.6 percent of gross domestic product (GDP) by 2030 and 13.6 percent by 2040 if no actions are taken (The World Bank, 2022). It is imperative for the government to invest not only more but also better on disaster risk reduction and development. And investing better includes ensuring that the poorest and most vulnerable localities–those who are impacted by disasters the most–are prioritized. “Hyper-local” data and intelligence on climate and disaster risks have been produced by the government and have been made available to local stakeholders such as through the Department of Science and Technology (DOST)’s GeoRiskPH. The analysis of risks can be enhanced by granular data on socioeconomic vulnerabilities such as those offered by the machine learning-generated poverty estimates.

Leaving No One Behind through Data Innovation
Machine learning-generated estimates of poverty and other socioeconomic phenomena may not fully replace surveys and other “traditional” data collection tools. In fact, the machine learning model will not yield accurate results if it is not anchored on the “ground truth” produced by high-quality surveys. For this, the government should be lauded for investing in improving the frequency and granularity of the FIES, DHS, and other surveys which are key to producing SDG data.
But innovations in data collection and analysis should be explored and adopted. These innovations–including machine learning-based estimates using geospatial data–can be used to help fill SDG blind spots, improve the frequency and resolution of analytics, and in turn fine-tune SDG actions. With six years left until the global deadline to meet the SDGs, we need all the data we can get to ensure no one is left behind. As British physicist Lord Kelvin’s timeless adage goes: “What is not defined cannot be measured. What is not measured cannot be improved.” [E]
NOTES
[1] Explore details of the SDG data availability in the Philippines using ETH Zurich’s SDG Monitor as well as the UN Department of Economic and Social Affairs SDG Indicators Database.
[2] PSA produces Small Area Estimates (SAE) of income poverty rates at the level of cities and municipalities based on the Elbers, Lanjouw, and Lanjouw (2003) methodology (see also these World Bank guidelines by Corral, Molina, Cojocaru & Segovia, 2022). These project-produced estimates are typically released three years after the reference year (two years after the official poverty statistics).
[3] The 2023 FIES costs PhP 589.7 million to reach about 180,000 sampled households nationwide.
[4] Further details are discussed in this technical note as well as in Ledesma et al. (2020)
[5] The 2017 DHS has downloadable data sets with geographic coordinates for household clusters.
[6] See the UNICEF AI4D Relative Wealth project website for technical details.
[7] The Spearman correlation between the 2022 DHS and the wealth index estimates is 83.9 percent, indicating a strong alignment. A linear regression analysis also resulted in an R-squared of 69.7 percent.
[9] I.e., Relative Poverty Index = 1 - Relative Wealth Index
[10] The DHS and the FIES years do not coincide: DHS years were 2017 and 2022, while FIES years were 2018, 2021, and 2023.. For reference, the official FIES-based poverty incidence among individuals in 2021 is 18.1 percent.
[12] Climatic Impact Drivers identified in the Plan are (i) increased temperature and drought, (ii) sea level; rise and extreme sea levels; (iii) extreme precipitation; and (iv) extreme winds and tropical cyclones.
References
Addawe, M. and A. Martinez (2021). Mapping the Spatial Distribution of Poverty Using Satellite Imagery in the Philippines. Manila: Asian Development Bank. https://www.adb.org/sites/default/files/publication/682851/mapping-poverty-satellite-imagery-philippines.pdf
Bündnis Entwicklung Hilft / IFHV (2023): WeltRisikoBericht 2023. Berlin: Bündnis Entwicklung Hilft. Retrieved from: https://weltrisikobericht.de/wp-content/uploads/2024/01/WorldRiskReport_2023_english_online.pdf
Corral, P., Molina, I., Cojocaru, A., This & Segovia, S. (2022). Guidelines to Small Area Estimation for Poverty Mapping. Washington, D.C.: World Bank Group. https://documents.worldbank.org/en/publication/documents-reports/documentdetail/099115306242236696/p1694340364c9803d0b7df097798bc42eac.
Elbers, C., Lanjouw, J., & Lanjouw, P. (2003). Micro–level Estimation of Poverty and Inequality”. Econometrica, 71(1), 355–364.
Goessmann, C., Idele, P., Jauer, K., Loinig, M., Melamed, C., Zak, T. (2023). Pulse of Progress: Mapping the State of Global SDG Data in 2023. New York: United Nations. https://www.data4sdgs.org/resources/pulse-progress-state-global-sdg-data.
Ledesma, C., Garonita, O., Flores, L., Tingzon, I., and Dalisay, D. (2020). Interpretable Poverty Mapping Using Social Media Data, Satellite Images, and Geospatial Information. Presented at NeurIPS 2020 Workshop on Machine Learning for the Developing World. https://arxiv.org/abs/2011.13563.
Martinez, A., M. Addawe, J. Bulan, R. Durante, K. Fenz, M. Hoffer, M. Martillan, T. Mitterling, T. Sako (2020 September). Mapping Poverty Through Data Integration and Artificial Intelligence. Special Supplement of the Key Indicators for Asia and the Pacific 2020. Manila: Asian Development Bank. https://www.adb.org/sites/default/files/publication/630406/mapping-poverty-ki2020-supplement.pdf
Philippine Statistics Authority (2024). PSA Releases the 2021 City and Municipal Level Poverty Estimates. https://www.psa.gov.ph/statistics/poverty-sae.
Sachs, J., Lafortune, G., & Fuller, J. The SDGs and the UN Summit of the Future: Sustainable Development Report 2024. Paris: Sustainable Development Solutions Network and Dublin: Dublin University Press. https://dashboards.sdgindex.org/chapters.
The World Bank. (2022). Philippines Country Climate and Development Report. https://openknowledge.worldbank.org/entities/publication/3f76eedd-4ab6-5250-ab4e-75f39593f1b3.
